Maritime Business Intelligence
An intelligent decision-support reporting platform powered by cutting-edge analytical tools
Powered by intelligent analytical tools that scan, monitor, and showcase trends of near real-time data. Users can share parameterized reports effortlessly with external clients and stakeholders. Monitor trends over time for historical data, track process efficiency, identify bottlenecks, and implement changes on a user-friendly platform. Gain valuable insights, optimize performance, enhance decision-making, and achieve operational excellence in the dynamic and competitive maritime sector. This maritime business intelligence offering empowers maritime organizations to embrace a more data-driven approach, enabling them to make informed decisions confidently.
Tailored for Maritime Needs: Our BI tools are specifically engineered to meet the unique challenges and demands of the maritime industry
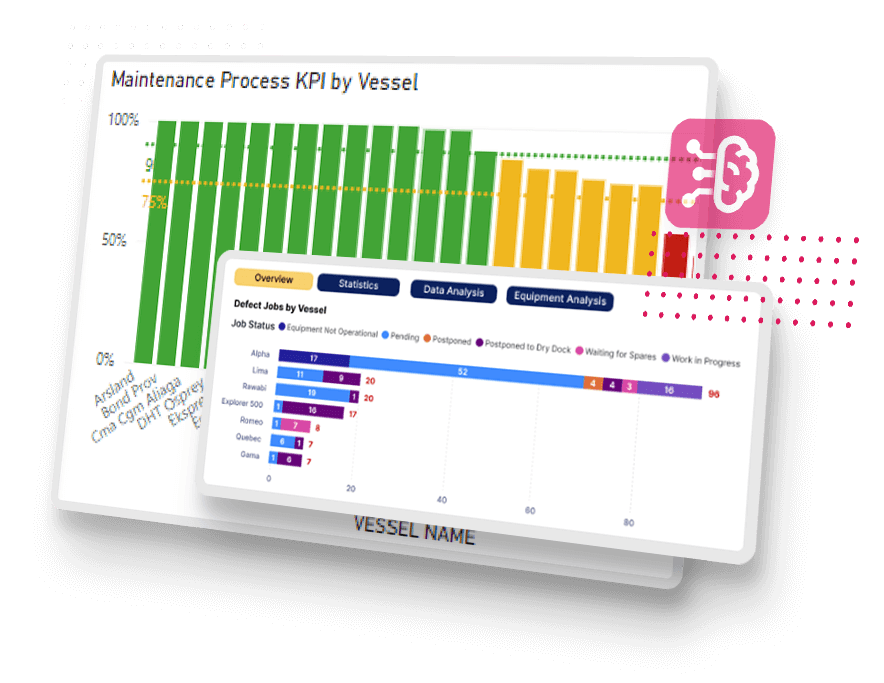
Simplified Data Visualization: Transform complex data into easy-to-read, intuitive visuals that anyone can understand and utilize
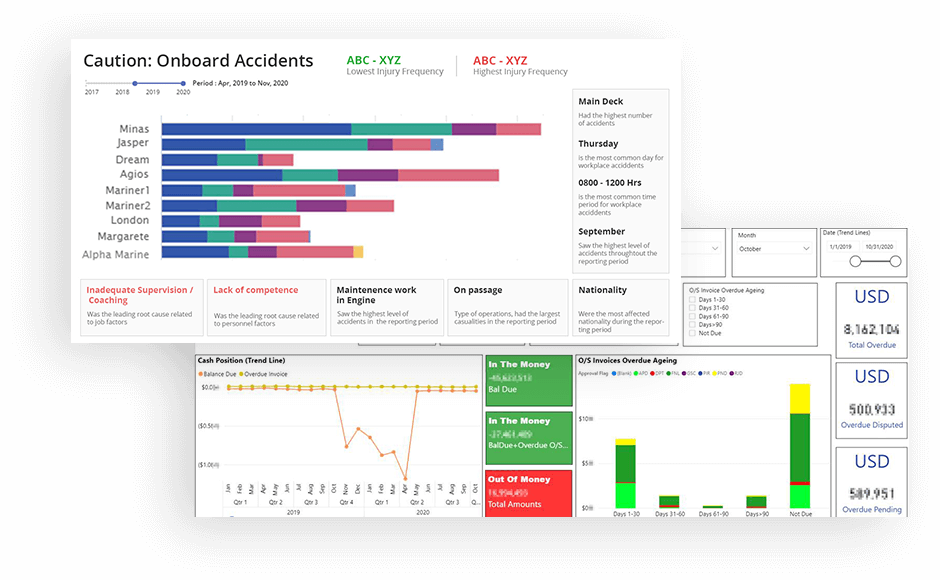
Data-Driven Insights: Empower your decisions with in-depth data analysis, driving operational efficiency and maximizing profitability
Flexible and Scalable: Our BI platform grows with your business, catering to both small shipping companies and large global fleets. New reports can be included in the reporting platform per business requirements
Enhanced Decision-Making: Facilitates informed decision-making with dynamic dashboards and detailed reports, enabling quicker responses to market changes and opportunities
Improved Operational Efficiency: Online transactional data (OLTP) can be provided as standard Datamart views. This allows end users to create reports and perform queries without IT assistance, facilitating swift and informed decision-making
Comprehensive Data Integration: Combine data from multiple smartPAL modules to provide a complete and accurate view of your maritime operations
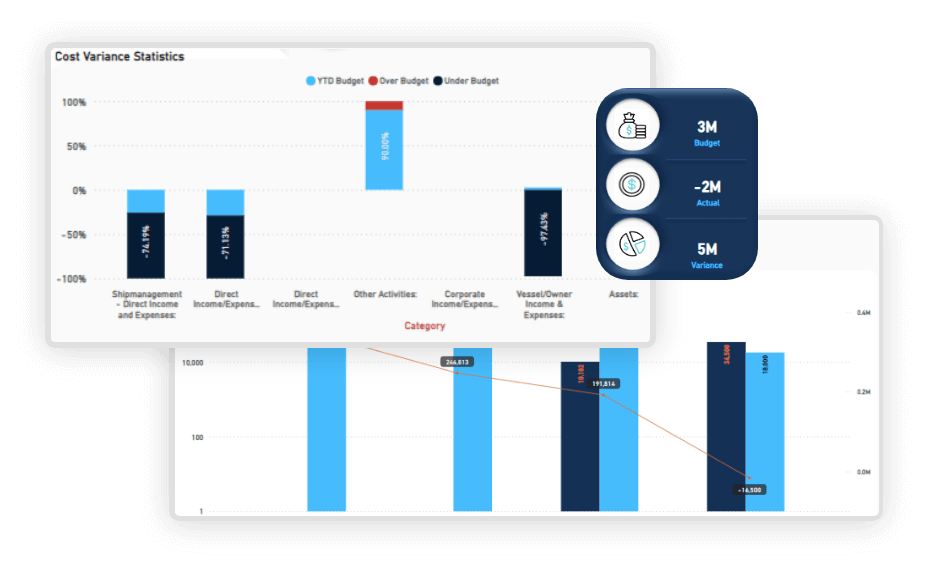
Customizable KPI Tracking: Monitor key performance indicators that matter most to your business with flexible reporting options
Empower Stakeholders with Insights: Give stakeholders the precise data required to make informed decisions and drive growth
Streamline data extraction with BI Datamart
The BI Datamart utility efficiently extracts and organizes large volumes of data from the smartPAL application, enabling seamless analysis of critical information across smartPAL modules. smartPAL BI empowers businesses to make informed, data-driven decisions with enhanced speed and accuracy.
Benefits:
- Enhanced Performance: Experience faster data extraction and analysis
- Simplified Access: Easily retrieve relevant data from smartPAL modules
- Increased User Autonomy: Gain more control over data without IT dependency
- Scalability & Flexibility: Seamlessly adapt to growing data needs
- Robust Security: Ensure better governance and data protection measures

Frequently Asked Questions
A data-driven reporting tool called smartPAL Business Intelligence (BI) combines data from several smartPAL ERP modules, such as operations, finance, crewing, and maintenance, to provide centralized insights for quicker, more intelligent maritime decision-making.
By automatically extracting and structuring OLTP data from routine operations into standardized data views, the smartPAL BI Datamart allows users to swiftly analyze big datasets without affecting the performance of the live system.
smartPAL BI is scalable and adaptable, supporting businesses of all sizes thanks to its modular, cloud-enabled architecture. It readily grows with fleet data, enabling the addition of custom reports and KPIs in accordance with business needs.
Using clear charts and trend analytics, smartPAL BI transforms intricate operational datasets into interactive, visual dashboards that enable both technical and non-technical users to quickly grasp important insights.
Without coding knowledge or IT assistance, users can create reports, filter data, and run queries using the self-service BI tools, facilitating quicker, data-driven departmental decision-making.
In order to improve fleet productivity and operational control, users can monitor historical data trends over customizable timelines to spot inefficiencies, process bottlenecks, and performance deviations.
smartPAL BI helps maritime businesses increase profitability and attain operational excellence by identifying cost drivers, efficiency gaps, and optimization opportunities through the use of advanced analytics and performance metrics.
By supporting customizable KPI dashboards, the BI module enables users to create, measure, and track key indicators that are specific to their operational objectives, such as fuel cost, vessel uptime, or voyage efficiency.